
LifeTime Income is the calculator in the wellness platform used to find expected retirement income, meaning the amount you will have per month after retirement. The Lifetime Income tab is located on the left sidebar in the platform.
When you navigate to Lifetime Income, there are four assumptions taken into consideration (note: you must have your income and birthday entered under your profile to use the calculator).
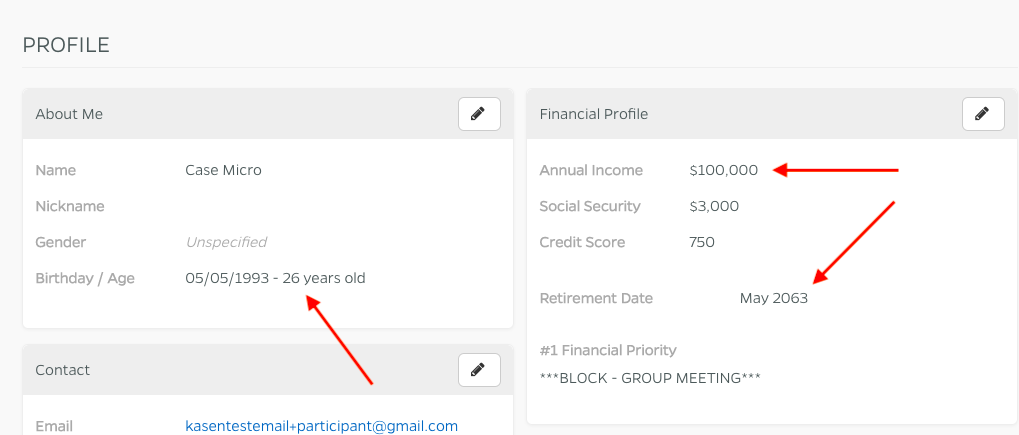
Info from user's financial profile.
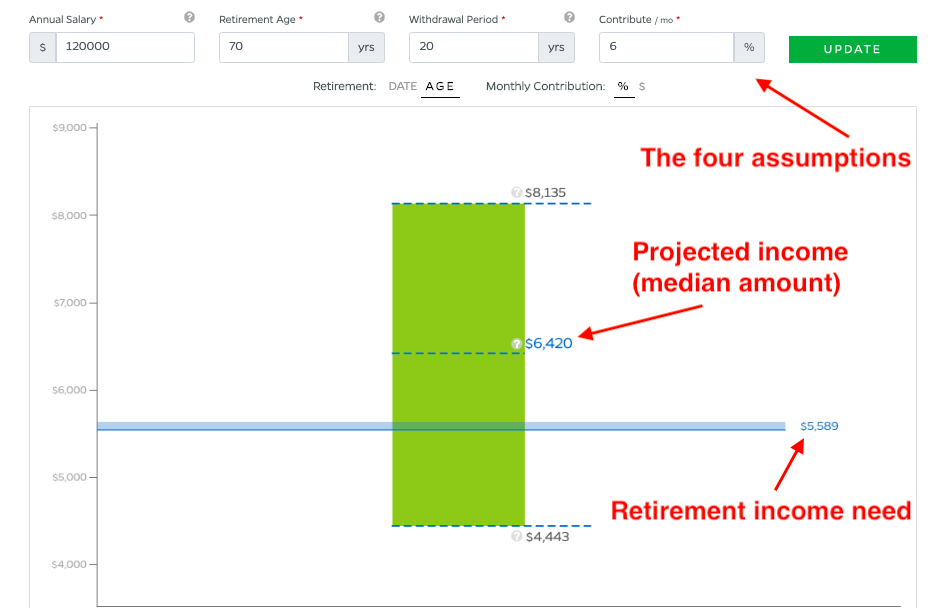
The four assumptions in Lifetime Income are:
- Annual Salary - your income
- Retirement Age - the age at which you wish to retire (can also select a date)
- Withdrawal Period - how long you expect to need to withdraw (life expectancy)
- Contribute/mo - what you are contributing per month to retirement (choose between a percentage or a dollar amount)
 Assumptions based on profile information. All of the inputs are editable.
The tool will populate the assumptions automatically to begin with, based on numbers from your profile, but you can adjust each assumption.
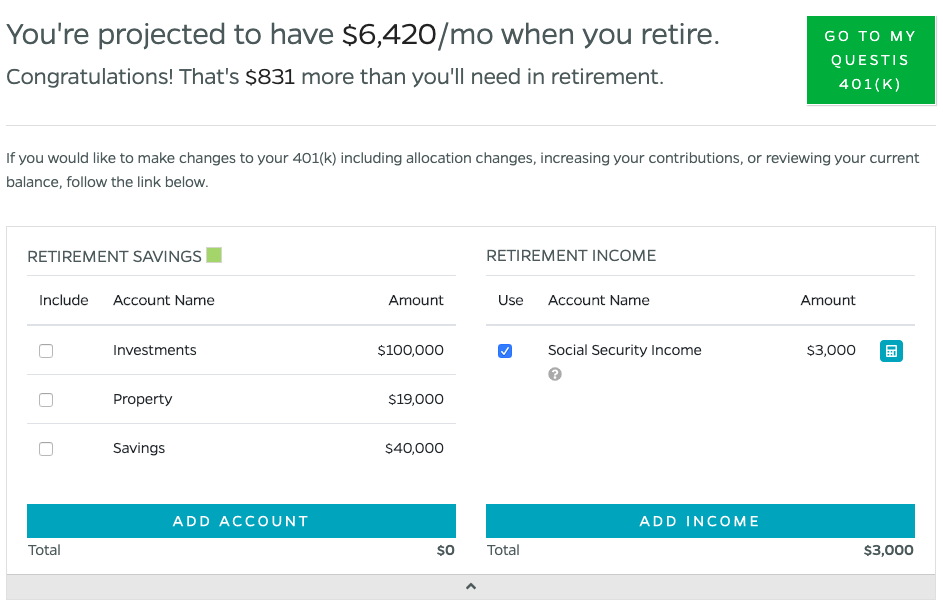
Social Security will show under the Retirement Income section along with other income streams you know you will have in retirement. Any savings you have associated with your account will appear under Retirement Savings. This will draw from accounts you have connected in the My Money section of the platform (or from accounts you add right there in the retirement calculator by clicking "Add Account").
In the graph below the assumptions, you will see a bar chart with a horizontal blue line. The blue line is your monthly need income. All projections are calculated based on monthly amounts. Your withdrawal need is adjustable by dragging the bar or by inputting numbers on the right side of it. The system defaults to a 70% replacement ratio, so 70% of your current monthly income is your (assumed) withdrawal need amount.
The retirement calculator uses the Monte Carlo simulation. This means that risk and other unknown variables are factored into the projections.
The top dotted line shows the upper 75th percentile for the distribution; 25% of the outcomes were larger than or equal to that amount. The middle dotted line is the median value of your estimated retirement income, while the bottom dotted line represents the 10th percentile of distribution, meaning 90% of projected outcomes are greater than this amount.
In our example:
- 25% are greater than or equal to $8,135
- The median value is $6,420
- 10% are less than or equal to $4,443
If you have questions related to the portfolio makeup assumptions, there is a link in the bottom left corner called "Key Assumptions and Material Limitations." Here you will get to see what it set defaults to, and other details about the calculator.
If you have questions please reach out to our support team at support@myquestis.com.
Comments
0 comments
Please sign in to leave a comment.