ℹ️ — You will need to add your investment accounts on the Accounts tab before the investment tool will populate with data.

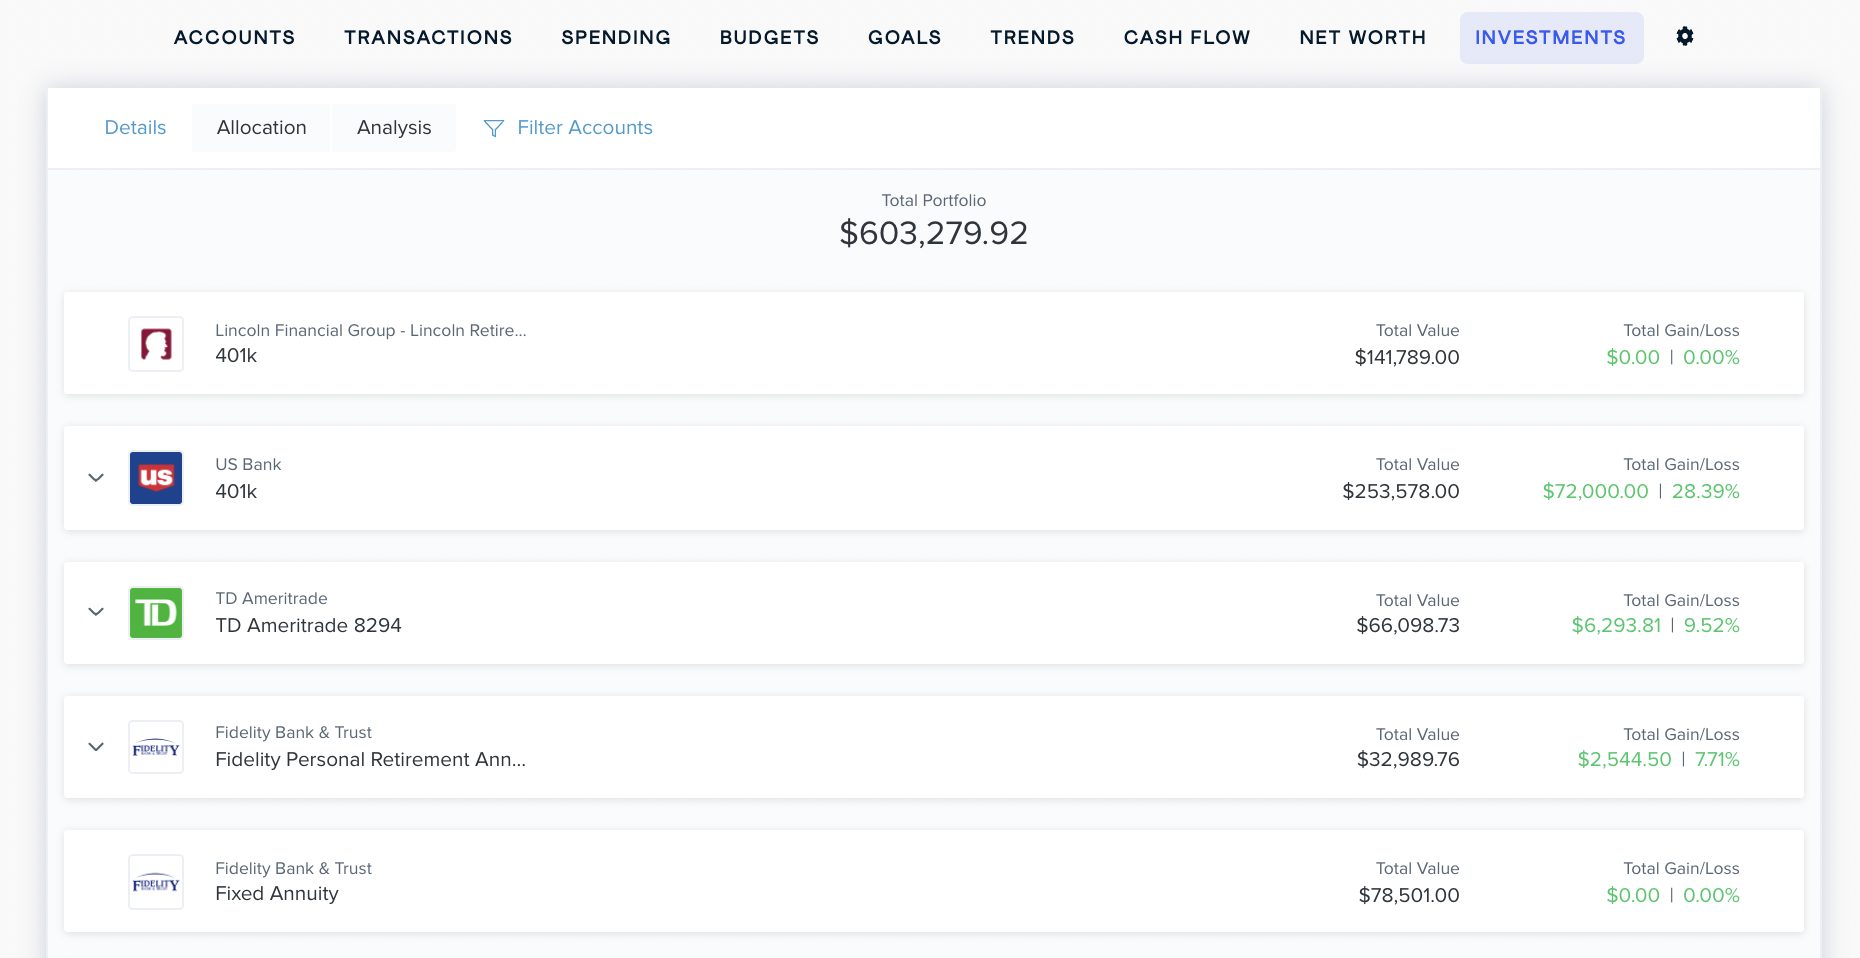
The initial screen will show you your investment details. Here you'll see a list of the investment accounts you've added to the software. Above, you'll see the total value of your investment portfolio. To the right, you'll see the value of each individual account, as well as the gain or loss on that account based on the cost basis.
A cost basis may automatically appear, or you may need to enter it manually. The cost basis for an individual security can often be found in the tax section of your brokerage firm's report.
The following types of investment accounts can be added to the software:
- General Investment
- Plan 401(k)
- Plan Roth 401(k)
- Plan 403(b)
- Plan 529
- IRA
- Rollover IRA
- Roth IRA
- Taxable
- Non-taxable
- Brokerage
- Trust
- Uniform Gifts To Minors Act
- Plan 457
- Pension
- Employee Stock Ownership Plan
- Simplified Employee Pension
- Simple IRA
- Fixed annuity
- Variable annuity
Within these account types, you may see one or more of the following types of holdings:
- Equity: These represent an an ownership stake in in a company, usually in the form of stock, but sometimes other types of securities.
- ETF (exchange traded fund): These represent an ownership share of a fund made up of other assets, which could be stocks, bonds, futures, gold, or any number of other things. Shareholders don't own the underlying assets, just the right to some of the profits generated from those assets.
- Money market: These are cash accounts which are like both a savings account and a checking account combined. They return higher yields than savings or checking accounts but may have restrictions on how often money can be withdrawn. They may also require a minimum balance.
- Mutual funds: These are companies run by professional money managers whose job is to invest the money of people who buy shares in the mutual fund company. Managers may change their investments, buy, and sell the underlying assets in order to meet performance goals. However, these shares are not traded on an exchange, like ETFs above.
- Hedge fund: These are investment companies that aren't available to the general public and are thus regulated differently than mutual funds or other types of funds. They generally invest in relatively liquid assets and may have an investment strategy aimed at getting a return whether markets go up or down, hence the term "hedge."
- Annuity: These financial products pay out money on specified schedule after a certain period of time, called annuitization. Money is invested during this time (which can last from 2 to 10 years or more), and then begins paying out in a predictable stream. This is often used as retirement income or providing for long-term care.
- UIT (unit investment trust): These investment companies are much like mutual funds, except they have fixed portfolios that allow investors to know what securities are held from the date of deposit until maturity. This is generally two years. UITs are not actively manages and should be considered as a long-term strategy. They are not intended to be traded prior to maturity.
- Cash: These are the funds in your account that have not yet been invested in a security.
- Fixed income: These holdings produce a specific, predictable, regular level of income. They are generally predictable and stable. There are many kinds, but bonds are the most common type of fixed-income holding.
- Options: These grant the holder the right to buy or sell a stock in the future at a price specified at the time of purchase. If the market price differs from the agreed-upon price, the option holder may earn a return.
- Unknown: Sometimes we are unable to determine the security type of a particular holding. When this happens, you can manually set the security type.
Click on any account to view the specific holdings.

The holding's symbol and name are to the left. To the right, you'll see the quantity you own, the cost basis, the current market value of the holding, and the gain or loss since it has been tracked. If your investment includes a cash balance, it will be shown at the bottom of the list.
For the software to track your gains and losses accurately, you'll need to know the cost basis of each holding. The cost basis is the original price you paid for a given holding. It may be imported automatically, or you may need to enter it manually.
To edit the cost basis of a particular holding:
- Click an account to bring up holding details.
- Click on the cost basis figure; as you hover over it, it will read "Click to edit."
- Enter in the correct purchase price, including any commission paid. In the event you made multiple purchases of the same security, the cost basis for each purchase will need to be added together before entering it into the software.
Allocation

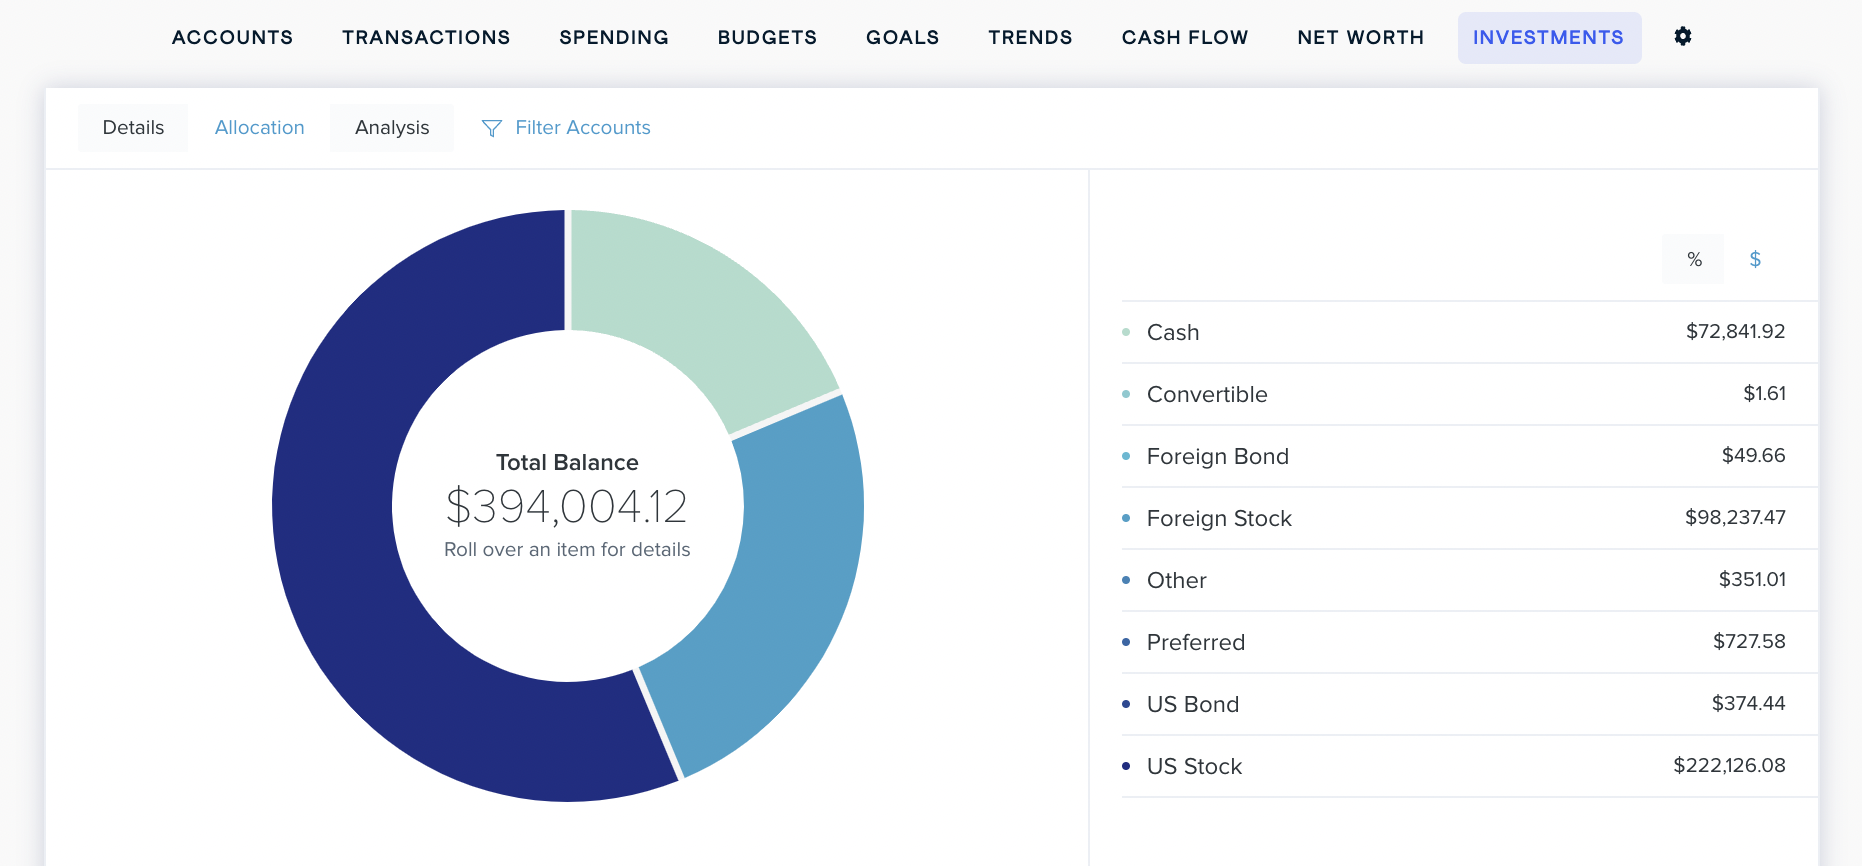
The Investment tab includes an allocation tool that gives you a simple visualization of your current allocation, allowing you to understand your investments and adjust them as necessary.
Investment experts often break down allocations into three broad strategies: conservative, moderate, and aggressive. A conservative approach is less risky, but may not bring the highest returns. An aggressive approach may bring higher returns, but is more risky.
ℹ️ — In the allocations below, the "other" group refers to investments like private equity funds, hedge funds, real estate investment trusts, derivatives, or other less-common types of holdings.
Conservative:
- 19% U.S. stocks
- 6% international stocks
- 55% bonds
- 7% cash investments
- 13% other
Moderate:
- 38% U.S. stocks
- 18% international stocks
- 30% bonds
- 2% cash investments
- 12% other
Aggressive:
- 58% U.S. stocks
- 30% international stocks
- 0% bonds
- 2% cash investments
- 10% other

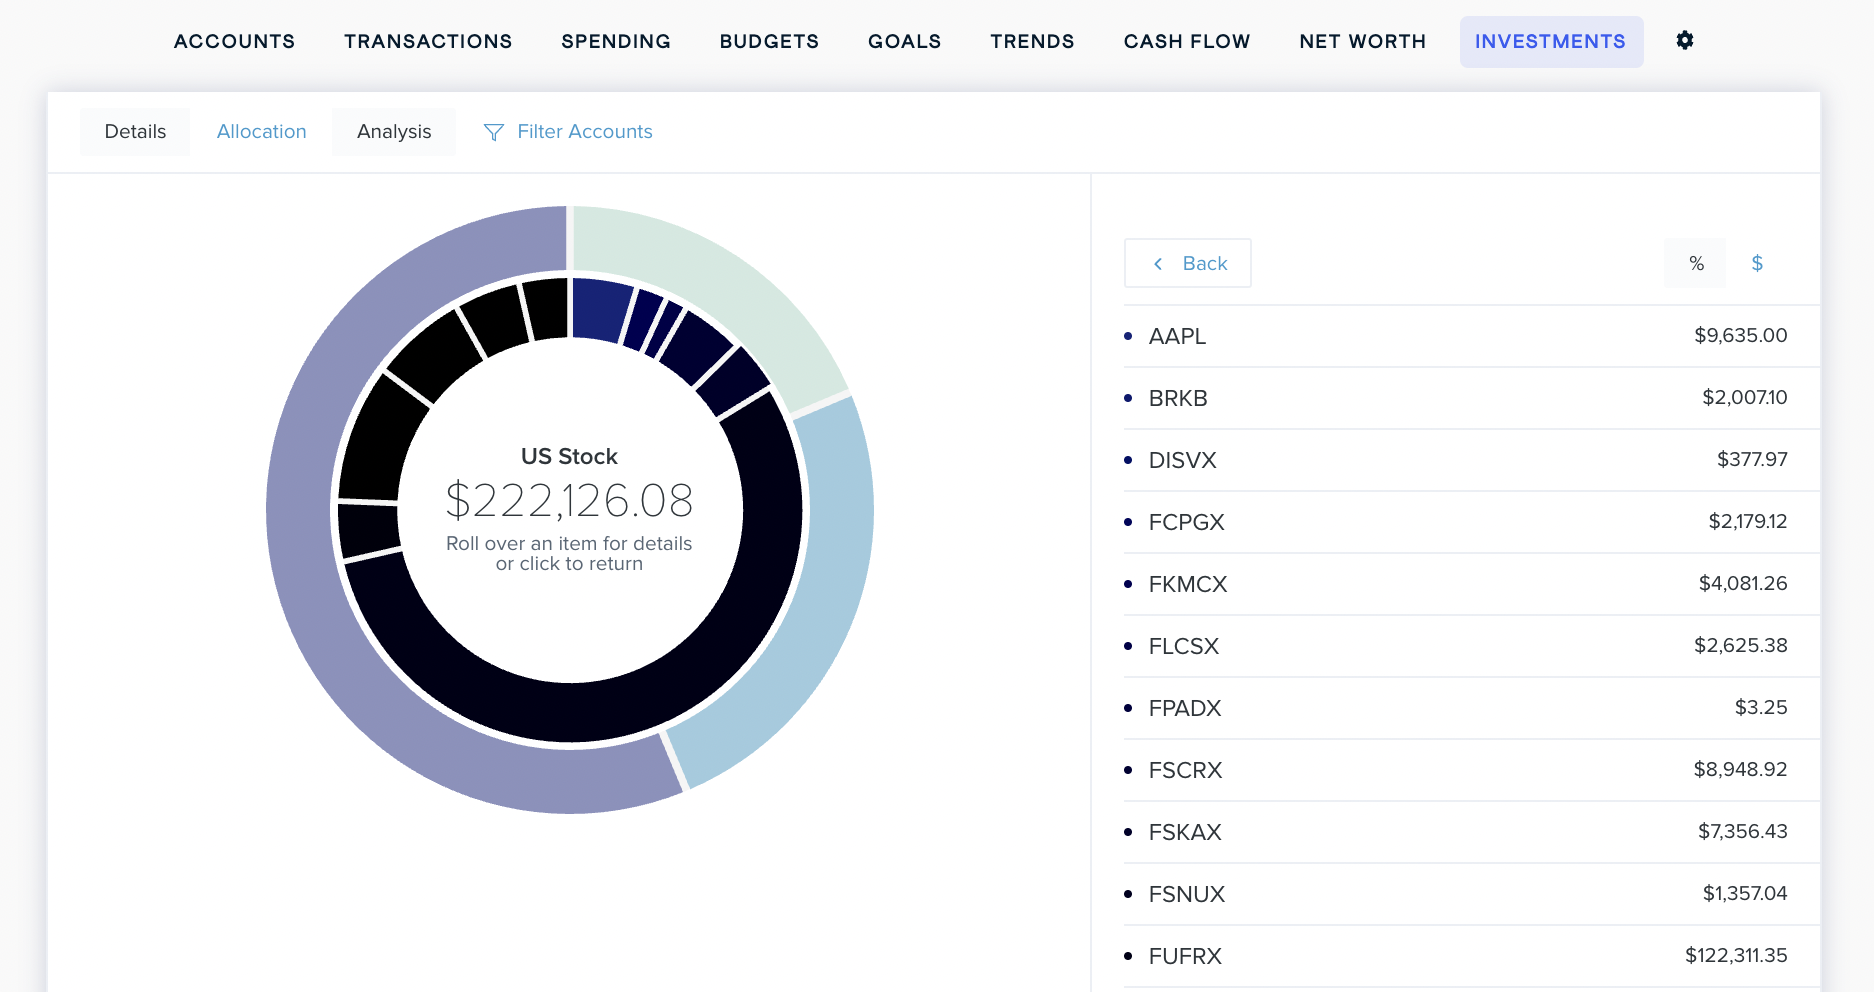
Hover over a piece of the investment wheel to see the amount you have invested in that category, and click on a piece of the investment wheel to being up a list of holdings in that investment category
You can view your allocated holdings in terms of dollar amounts or as a percentage of your total investments. The default is dollars.
To toggle between dollars and percentages:
- Click the "%" button on the top right above the list of holdings types.
- Click the "$" button to return to dollars.
By default, all of your connected investment accounts are included in the investment wheel. You can, however, choose to display one account at a time.
To change the account displayed in your investment wheel:
- Click on the "Filter Accounts" dropdown menu at the top.
- Uncheck the account you would not like displayed in the investment wheel.
- Press "Apply" to confirm.
Analysis

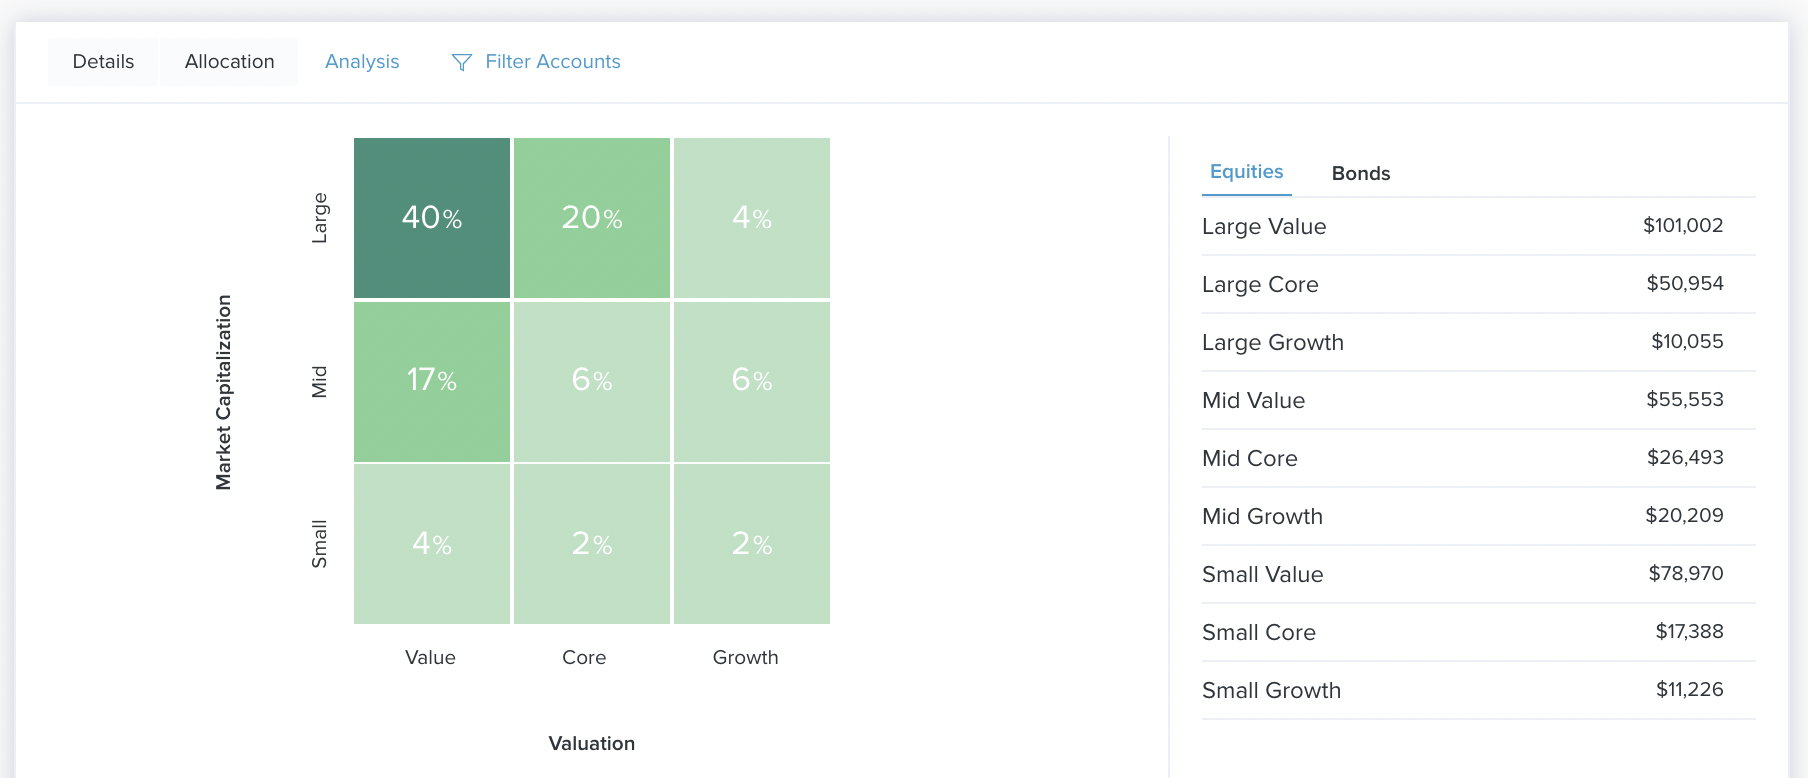
You can take your investment strategizing another level deeper with the analysis tool. This visualization takes your stocks and bonds and breaks them down into nine different categories based on factors like quality and growth potential. These categories are displayed as an easy-to-read grid so you can get a quick and accurate read on what kinds of investments you have.
In order to use the analysis tool properly, it's important to understand the basic differences between stocks and bonds:
Stocks are pieces of a company. When you buy a stock, you literally own a tiny piece of the company that issued the stock. When that company is doing well, the value of your piece of the company generally increases, and you can sell it for more money than you paid, thus bringing in a return. If the company is doing poorly, your piece of the company will generally be worth less, and you may lose money by selling.
Stocks range in terms of their risk, but they are, in general, considered to be more risky than bonds. However, you shouldn't forget that in the long run, a diversified portfolio of stocks is very likely to increase in value, which is why they are among the most important investments.
Bonds are not like stocks: bonds are like an I.O.U. When you buy a bond, you are essentially loaning someone your money (often a government, but also companies) with the promise that they will pay it all back, plus interest. You could get that interest in a yearly or even quarterly payment, or in one lump sum when the bond matures. When a bond matures, you get all your money back; some bonds may also pay interest at maturity, rather than yearly.
Bonds are generally considered to be safer than stocks because of their long-term nature, but they may not bring in the same high returns. Bonds are generally predictable and steady. Because they return a specified interest, they are often referred to as "fixed-income" investments. Though there is always a small chance that a bankruptcy or default will happen, this is unlikely, especially with high-quality, long-duration bonds.
Stocks
By default, you'll see the "Equity" tool. While we can't say that one investment strategy is the best or that there is an ideal mix of the various types of stocks in your portfolio, the stock analysis tool will help you understand and visualize your particular situation.
The horizontal axis of the equity analysis tool represents investment style:
- Value: These are stocks that are seen as being underpriced by the market, or cheaper than they should be. Investing in these stocks may yield a return as the price goes up.
- Core: These are stocks that seem to have characteristics of both value and growth stocks.
- Growth: These are stocks for companies that have shown strong growth over the last few years and are likely to continue growing at a fast clip. Investing in these stocks may yield a return as the company's overall size and importance increases.
The vertical axis represents a company's market capitalization — that is, the total market value of all the company's stock. The market "cap" can give you an idea of how much a company is worth, as well as an idea of how desirable its stock is to other investors. A balanced portfolio will have stock from large-, medium-, and small-cap companies.
- Large: These companies are typically worth tens of billions of dollars. More specifically, the analysis tool defines large-cap companies as those which represent the top 70 percent of the total market capitalization in a given geographic area.
Large-cap companies are often the most important, most established, better-known, most stable, or most dominant in a given industry. They are often considered less risky by investors, but may not bring in the highest returns.
- Mid: These companies are typically worth a few billion dollars, but probably less than $10 billion. More specifically, these companies represent the middle 20 percent of total market capitalization in a given geographic area.
Mid-cap companies are often thought of as more or less established and important in their given industry. They may not be the most well-known, but they are nevertheless important and are expected to increase their importance, competitiveness, and dominance in the future. They are usually more risky than large-cap stocks, but less risky than small-cap stocks.
- Small: These companies are typically worth less than a billion dollars. More specifically, they represent the bottom 10 percent of total market capitalization in a given geographic area.
Small-cap companies are often either newcomers to a particular market or perhaps serve a niche market in an industry. They may not be well-established, especially stable, or important within a particular industry, but they may also be poised to grow quickly or become much more established. While they offer an opportunity for high returns, they are nevertheless considered risky by most investors.
To view the equity analysis tool:
- Click the "Analysis" button on the top left of the Investments tab.
- Click the "Equity" button on the right.
Bonds
To access the bond analysis tool:
- Click the "Analysis" button on the top left of the Investments tab.
- Click the "Bonds" button on the right.
You'll see a grid similar to the socks analysis tool. The vertical axis represents the quality of the bond, i.e. the credit rating.
- High: These bonds have a credit rating that is AA- or higher.
- Medium: These bonds have credit ratings less than AA-, but greater or equal to BBB-
- Low: These bonds have credit ratings that are below BBB-.
Bond quality gives you an idea of how likely you are to be paid back by the entity that loaned you money. Bond credit ratings range from AAA to C or sometimes even D, with AA+ being lower than AAA, AA- being lower than AA, and so on. The highest rating means you are almost certain to get your money back, plus interest. A very low rating means there is a significant chance you won't get all your money back.
The horizontal axis measures the duration of the bond. Duration is one of those things that is quite complicated, but what it's trying to measure is fairly simple to understand: risk. Bonds with a short duration are generally less risky than bonds with a longer duration.
More specifically, longer-term bonds are more likely to be negatively affected by changes in the interest rate set by the U.S. Federal Reserve. Higher interest rates cause bonds to lose value, while lower interest rates will cause bonds to lose less. So, a bond with a long duration is more likely to be negatively affected by an increase in the interest rate.
ℹ️ — The duration and maturity of a bond are not the same thing. They are related, however. The details are complex, but just remember that a bond's duration is always equal to or shorter than its maturity.
There are no exact numbers for what counts as a limited, moderate, or extensive duration, as these levels are calculated on a floating basis according to market conditions. But a good general guide is this:
- Limited: The bond's duration is roughly 3 years or less.
- Moderate: The bond's duration is between roughly 4 and 7 years.
- Extensive: The bond's duration is longer than roughly 7 years.

Comments
0 comments
Please sign in to leave a comment.